Air + surfaces
HDC3022-Q1 humidity/temperature, two DS18B20 surface probes and water detection coupon.
Kararti Solutions technical workspace
Choose your product; Review its architecture, design files and verification status together.
Rev A · cell-free desktop assembly
Research for climate resilience and thermal efficiency in electric vehicles. The first assembly monitors humidity, surface temperature and condensation risk on a metal coupon instead of a BMS board.
HDC3022-Q1 humidity/temperature, two DS18B20 surface probes and water detection coupon.
Dew point, data validity, physical ARM, hysteresis and time budget.
AO3400A driver, 91 Ω resistor; serial thermostat and thermal cutout. Recording via USB.
Monitoring internal humidity and the risk of condensation on cold surfaces; proper containment, coating and pressure balancing. Range gain is not written directly to the protection layer.
Better utilization of available waste heat, heat pump and preconditioning. The consumption of additional heating must be lower than the benefit it will provide; OEM BMS limits are maintained.
Sample metal coupon: 100×60×2mm. Experimental enclosure: approx. 150×100×60mm. These are dimensions of the laboratory bench setup, not of a final automotive product.
Power path + 3.3 V measurement circuit
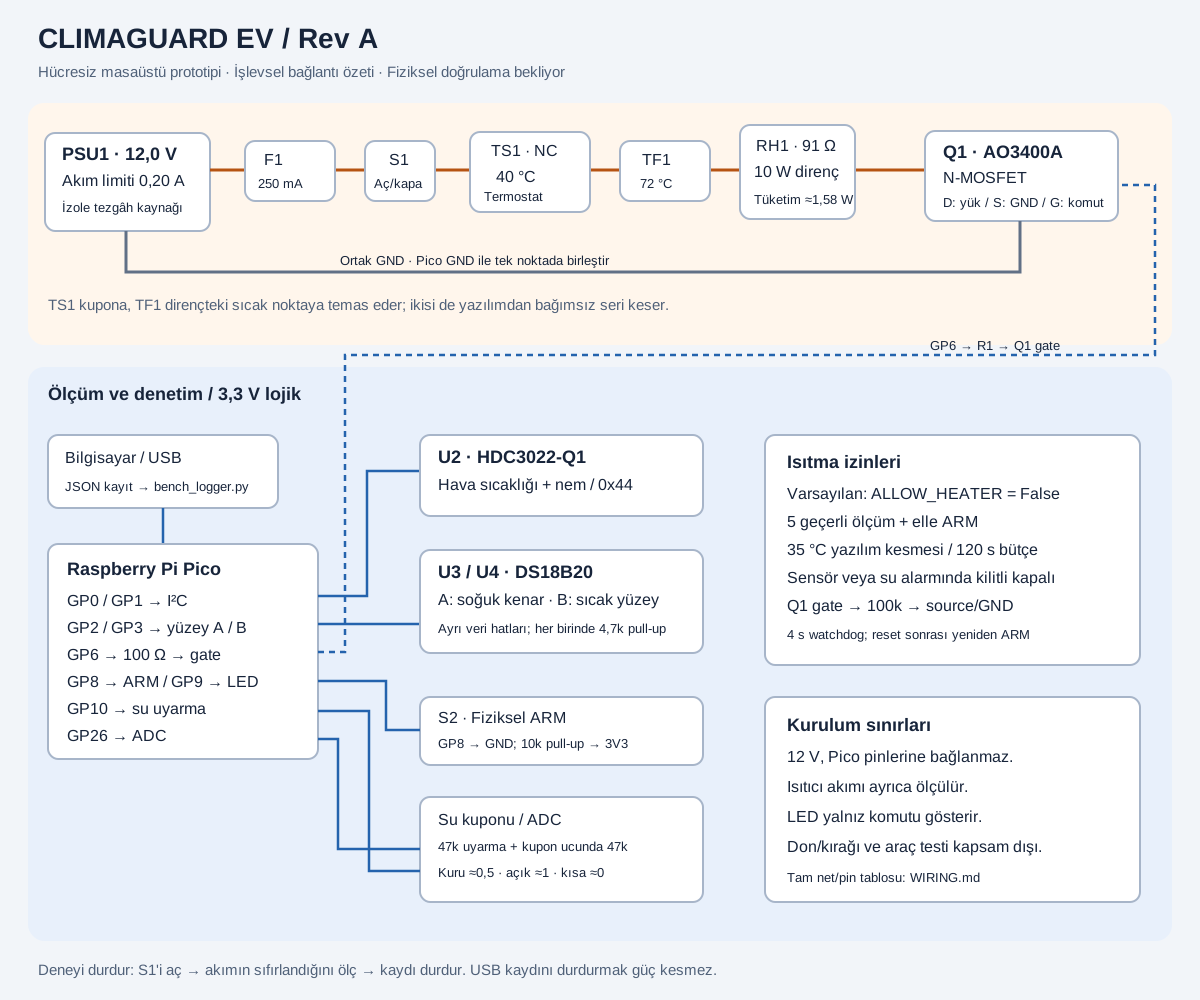
12V is not connected to the Pico pins. Pico is powered from USB, sensors are powered from 3.3 V. TS1 contacts the coupon and TF1 contacts the hot spot on the resistor, providing software-independent interruption.
| Function | GPIO | physical pin | Link |
|---|---|---|---|
| HDC SDA | GP0 | 1 | U2SDA; 4.7 kΩ pull-up to 3V3 |
| HDC SCL | GP1 | 2 | U2 SCL; 4.7 kΩ pull-up to 3V3 |
| Surface A data | GP2 | 4 | U3 DQ; R3 to 3V3 |
| Surface B data | GP3 | 5 | U4 DQ; with R4 to 3V3 |
| Heater command | GP6 | 9 | R1 → Q1 gate |
| Physical ARM | GP8 | 11 | 3V3 with R7; GND when S2 is off |
| Command LED | GP9 | 12 | R11 → LED anode; cathode GND |
| Water coupon warning | GP10 | 14 | SENSE line via R8 47 kΩ |
| Reading water coupon | GP26/ADC0 | 31 | SENSE → R10 1 kΩ → GP26 |
| analog ground | AGND | 33 | C4 and water voucher return; connected on Pico with common GND |
| 3.3V output | 3V3 OUT | 36 | U2/U3/U4, pull-ups; not 3V3_EN (pin 37) |
| digital earth | GND | 3 / 8 / 13 / 18 / 23 / 28 / 38 | Sensor and MOSFET source reference |
This diagram is a functional connectivity summary; It is not a production PCB or validated vehicle circuit. Full link notes are in the files section.
Rev A · hardware list
The exact manufacturer code, DC contact rating and installation of the thermal breakers are not yet finalized. The parts list is the design input before physical verification.
| ref | quantity | Part / desired feature | Function / selection note |
|---|---|---|---|
| U1 | 1 | Raspberry Pi Pico, RP2040, header pins soldered | MicroPython; USB power only |
| U2 | 1 | 3.3 V I²C breakout with TI HDC3022-Q1 installed | 0x44 address; pin/strap control; WSON bare chip does not plug into breadboard |
| U3, U4 | 2 | Analog Devices DS18B20+ with external VDD | Two separate 1-Wire lines; insulated fixing to the surface; verify pins instead of probe wire colors |
| Q1 | 1 | AO3400A on suitable SOT-23 adapter | N-MOSFET that can be driven with a 3.3 V gate |
| RH1 | 1 | 91 Ω, ±5% or better, 10 W, fireproof wire winding power resistor | Experimental heater; Secure insulated to metal coupon |
| F1 | 1 | 250 mA fuse + holder, at least 24 VDC | Heater branch; DC breaking capacity compatible with welding |
| S1 | 1 | On/off switch, ≥0.25 A / 12 VDC | Physically cuts off heater supply |
| TS1 | 1 | Normally closed mechanical thermostat; nominal 40 °C, switching on at 45 °C at the latest; ≥0.25 A / 12 VDC | Thermal contact to the heated coupon; automatic reclosable; MCU independent serial interrupt |
| TF1 | 1 | Disposable thermal cutter; nominal 72 °C, DC current rating suitable | Touching the hot spot on the resistor; Follow manufacturer's temperature/holding/mounting requirements |
| S2 | 1 | ARM switch with normally open dry contact | Closes GP8 to GND; It is not a power cutter |
| R1 | 1 | 100Ω | Q1 gate series resistance |
| R2 | 1 | 100 kΩ | Gate-source pull-down; off during reset |
| R3, R4 | 2 | 4.7kΩ | Pulling separate DS18B20 DQ lines to 3V3 |
| R5, R6 | 0–2 | 4.7kΩ | I²C pull-up; Add a second time if there is one in breakout |
| R7 | 1 | 10kΩ | GP8 → 3V3 pull-up |
| R8, R9 | 2 | 47 kΩ, 1% | Water coupon excitation resistor and termination at the coupon end |
| R10 | 1 | 1 kΩ | ADC input series resistance |
| R11, D1 | 1+1 | 1kΩ + LED | GP9 heating command indicator; it is not a current measurement |
| C1–C3 | 3 | 100nF ceramic | Near U2/U3/U4 supply |
| C4 | 1 | 100nF ceramic | ADC GP26 → AGND filter |
| J1–J5 | as required | Keyed/tagged connectors, short cables | 12 V and 3.3 V connections must be physically separated |
| W1 | 1 | Experiment coupon with two stainless electrodes; 1mm clearance; 47 kΩ termination away | Drop/line break test; Not a safety certified water sensor |
| M1 | 1 | Approx. 100 × 60 × 2 mm aluminum test plate | Thermal coupon instead of cell; resistor/probes electrically isolated |
| M2 | 1 | Transparent test enclosure, approx. 150 × 100 × 60 mm | Air exchange and sensor location repeatable; no ultimate IP class claims |
| PSU1 | 1 | Isolated, regulated laboratory supply: 12.0 V, 0.20 A current limit | Heater branch; output upper limit 12.6 V |
| measurement | 1 set | Multimeter, reference surface probe, preferably calibrated RH/T reference | Resistance, current, surface temperature and sensor comparison |
Power calculation: 12² / 91 ≈ 1.58 W. ≈1.84 W at 12.6 V and −5% resistor tolerance. The 10 W value of the resistor does not mean that 10 W was consumed in the experiment.
Software + independent physical protection
ALLOW_HEATER=False.Educational account; It is not a simulation of actual sensor data or full firmware. It does not drive any hardware.
A 2 s data age limit, 4 s watchdog and external gate pull-down complete the software layer. The series thermostat and thermal breaker operate separately. The command LED is not a physical current measurement.
verification status
Energy conservation, SOC/acceptance limits, sensor CRC, fault lock, hysteresis, time budget and log line were tested on CPython.
Work on the Pico, GPIO/reset behavior, sensor accuracy, thermostat cut-off and condensation A/B testing have not been performed yet.
A tank with 0.5 kWh thermal capacity, 15 kg and 35 W auxiliary consumption, added to the existing heat pump and regeneration system, was tested. The following values is the synthetic energy calculation; It is not a vehicle test or range promise.
| Scenario | Current system kWh | kWh with heat storage | savings |
|---|---|---|---|
| Cold city limited regeneration | 3.335 | 3.301 | +1.00% |
| Cold city · full acceptance | 3.054 | 3.089 | -1.14% |
| cold highway | 11.418 | 11.460 | -0.37% |
| temperate city | 2.164 | 2.199 | -1.61% |
| temperate highway | 10.515 | 10.558 | -0.41% |
Negative savings means additional consumption. With these results, the heat tank was not selected as the main part of the first product. Lightweight monitoring module and decision software for existing thermal system are being investigated; The range benefit of this software has not yet been measured.
Review · download · reproduce
Package; Includes hardware guides, Pico resources, PC recording program, tests, and research model.
Download the entire Rev A package · ZIPto Pico main.py, config.py, controller.py and hdc302x.py is copied. The heater is kept off. After hardware tests, physical activation is applied.
Closing the recording program does not interrupt the heater supply. The experiment is physically terminated with S1. The heater test cannot be started until the final part selection and physical verification of the cutters are completed.
FRAGWATT · Rev C · engineering viewer
All from the same data: each component in the diagram (344 references) appears layer by layer, with its function, quantity and connections in the component list, in its place inside the product in the 3D view, on its auto-oriented card in the CAD tab. Click on a component, navigate its links one by one with ◀ ▶; Jump to the same track in other tabs.
Click on a net name or component label (U4A, Q10A, R34…) in the diagram: its function, how many there are and which elements it is connected to are opened here.
Vector PDF, A3 landscape; For export to KiCad/Proteus component catalog (CSV), FRAGWATT BOOM and GaN 240 BOOM.
| ref | Quest | Piece/value | case | card | quantity |
|---|
Select a row from the list.
Click on a component in the 3D view (make the case transparent and the inside can be selected).
FRAGWATT says "I am an adapter of this power" via the ID line (Dell/HP 1-Wire, Lenovo/ASUS resistor) at the end plugged into the laptop. The laptop's embedded controller adjusts the graphics card and processor power limits accordingly.
TURBO: the exact class of the tip is declared (e.g. 330 W). The laptop works with full TGP as if it were plugged into the original adapter: highest FPS, fastest training, shortest time.
BALANCE: 75% of class (247 W at 330 W end). In most games, FPS loss is 5–10% and duration is extended by ~30%.
ECO: 55% of class (181 W at 330 W end). The laptop lowers its own power limits; LLM training typically slows down by 10–20%, but in Trio the time increases from 71 min to 92 min. Since graphics cards work more efficiently at low power, the work per unit energy increases.
On ends without ID pins (MSI, Acer) the profile is applied only with the output limit of FRAGWATT; In these cases, it is also recommended to select the laptop's own "Silent/Balanced" mode. The profile changes by long pressing the button on the top face or from the Kararti Link application.
GaN (gallium nitride) transistors switch much faster and with lower loss than silicon; so the charger with the same power is small and light (140 W ≈ 256 g, 240 W ≈ 400 g).
If there is an outlet, the GaN device plugs into USB-C1. TPS26750 contracts 28V (140W) or 48V (240W) with USB PD 3.1 EPR; BQ25756 converts this power to the battery bus (VBUS_SYS). The firmware first covers the load of the laptop: The peak moments when GaN is not enough come from the battery (phase A+B), and when the load decreases, the increased power charges the cells. With 240 W GaN, AAA gaming and LLM training lasted 3 hours at full power.
Click a component, pad, or track on the card. Navigate each pin of the component one by one with ◀ ▶: the pin's net, trace, vias and the components on the opposite side are highlighted.